The Likert scale can help you understand sentiment around your brand and the products you're putting out there so you can make the right choices.
Get a deeper understanding of what it is, when to use it, and how to make the most of it.
What is the Likert scale?
A Likert scale is a psychometric rating scale, usually with 5 – 7 points, used in questionnaires or as part of a larger survey to gauge the degree of sentiment or feeling towards something.
It’s often used to understand a customer’s experience with your brand. It can form the basis of a CSAT questionnaire about services, products, the checkout experience, and everything in between.
Over time, it has come to be used interchangeable with almost any type of rating scale. In its original form, the definition was more specific. Likert scales measured the degree of agreement with a question or statement.
Today, many types of Likert scales are accepted and used. Because a wider definition is now accepted, the rest of this article will focus on the modern definition and use cases of the Likert scale.
When should you use the Likert scale?
The Likert scale can be used to measure customer sentiment, satisfaction, or attitudes towards almost anything. They can be used after events to understand where you went right or wrong. It can be used to measure sentiment towards products, services, and experiences as well.
Put another way, a Likert scale is ideal when a simple yes or no answer won’t cut it. It helps you understand the degree of a feeling or attitude. Someone may like it and someone else may love it. A Likert questionnaire will distinguish between those two individuals.
These insights can be powerful for identifying psychographic segments in your audience and catering to them.
Likert questions which focus on the same or similar topics can be grouped together to form a “single topic” Likert scale. This aids in comprehension and improves the quality of answers.
Maximize the value of the survey by adding open-ended questions designed to find the reason behind a rating. Instead of only knowing a customer is satisfied or dissatisfied, you can find the specific reasons behind their stance. This is similar to the process used in an NPS survey but it’s more versatile.
How many points should a Likert scale have?
A Likert scale can consist of as many or as few questions as you want it to have. It’s important to provide enough options so your respondent can give an accurate answer. At the same time, you don’t want to provide so many answers that the degree of difference between each one is too small.
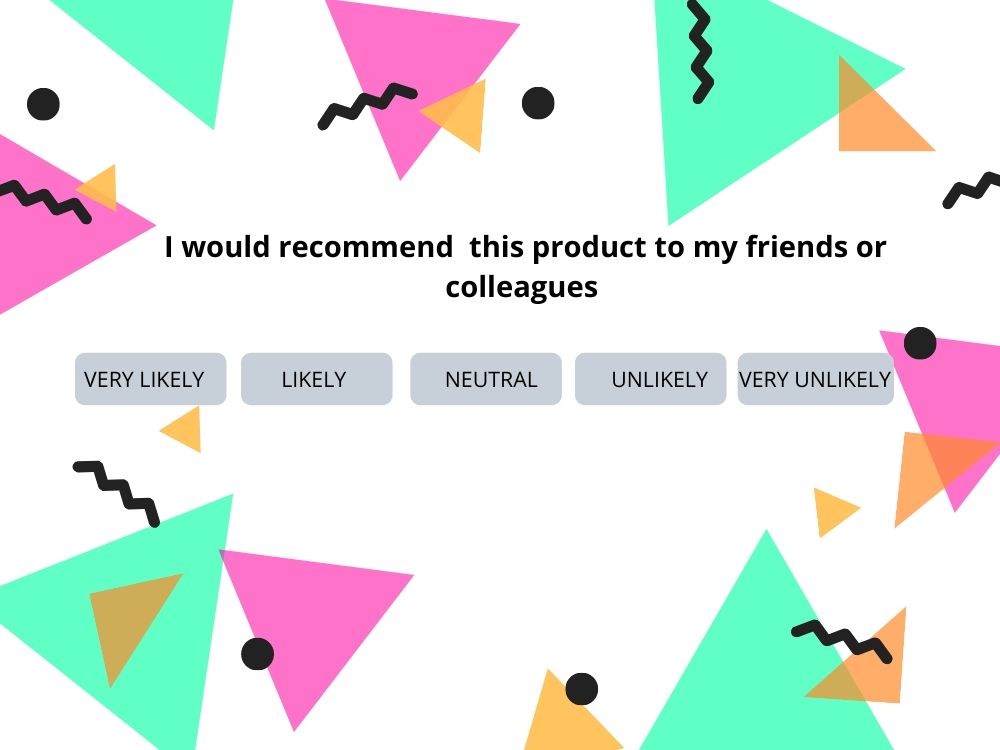
The generally accepted number is 5 – 7 answer options for a question. Most provide either 5 answer options:
Or seven answer options:
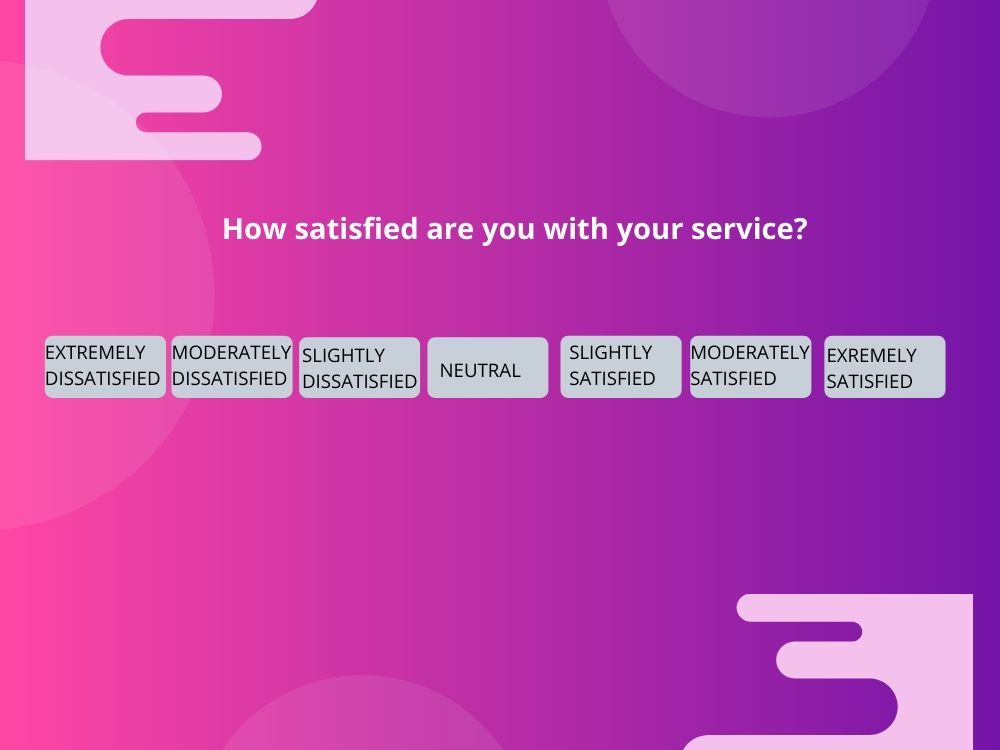
The 7-point scale allows respondents to give you a more nuanced answer without feeling overwhelmed. If there are too many options, your respondent may decide to skip the answer entirely.
There’s another thing to note about the difference between these 5-point and 7-point Likert scales. In the 5-point scale, the most negative response is a null or zero outcome. A customer won’t recommend the product but that may not mean they’ll recommend against it. The extreme positive and negative responses aren’t in opposition.
This is referred to as a unipolar scale. The range of answers goes from none to a maximum.
The 7-point scale does have polar opposites. In this instance, the central answer is the neutral point. The most extreme negative answer is the polar opposite of the extreme positive answer. The person who gives the extreme negative answer isn’t just unhappy, they see no redeeming qualities of the service.
This is referred to as a bipolar scale. The range of answers fall on either end of neutrality such as love and hate.
Odd and even number of options
I mentioned earlier that Likert scale questions have 5-7 answer options. There can be an odd or even number of answers. Neither is inherently better than the other but it will affect the way respondents are able to answer your questions.
An odd number of responses allows respondents to stick firmly in the middle or report a neutral stance.
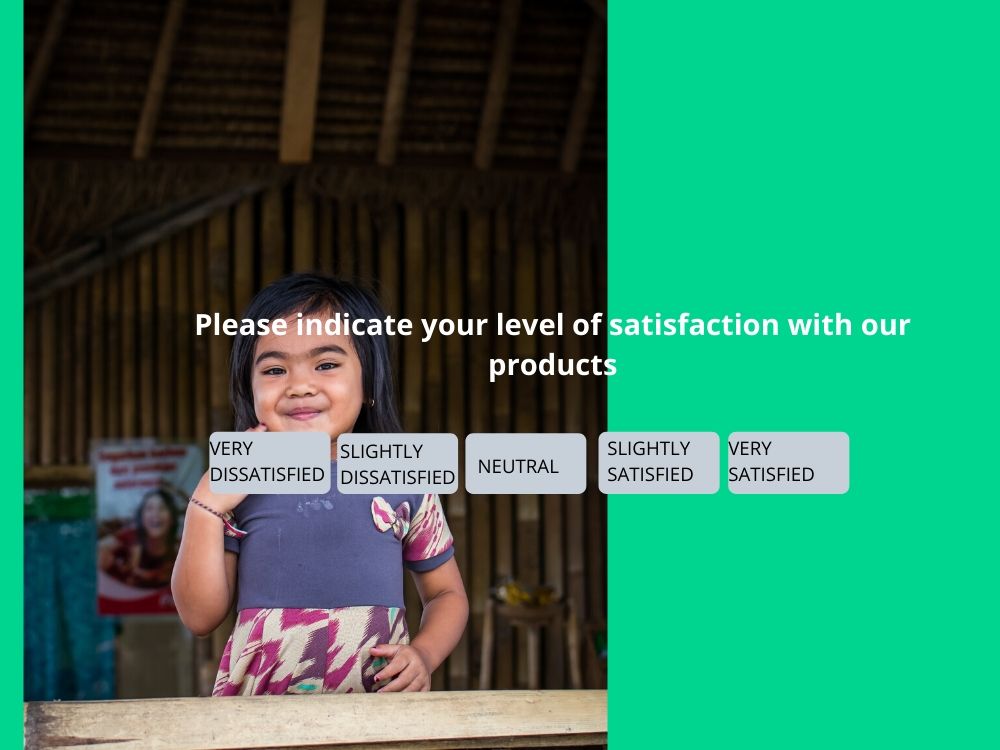
This can become an opportunity for people to skip the question when they don’t feel strongly enough about any of the other options. Some would argue this skews your data and makes the entire exercise less valuable.
You can also look at it from another perspective. The product, service, or overall experience may have been so underwhelming to the customer that they failed to form an opinion in either direction. This is valuable information in and of itself.
If you’re using follow up open-ended questions, you’ll be able to drill deeper into what led the respondent to that conclusion. From there, it’s possible to take corrective action (if that’s needed).
When you have an even number of answer options, there’s no way for someone to default to neutrality. This can prompt the otherwise neutral respondents to think more deeply about the situation. This can be helpful in specific situations and harmful in others.
If someone doesn’t have an option or is neutral, forcing them to choose positive or negative can skew your results in the wrong direction.
No matter what you do, there’s an opportunity for people to give you intentionally incorrect answers. That’s why it’s important to follow up with open ended questions to further clarify their stance.
Likert scale reporting
Surveys can get complicated. Statistical modelling, standard deviations, prevalence of distortions, etc. can all be factored in. We’re going to focus on a simple way to interpret the raw data so you can derive meaningful insights.
We want to understand the percentage of people that answered individual questions a specific way. For example, we’ll want to find out the percentage of people who were extremely satisfied and the percentage that were extremely unsatisfied.
The most common method of interpreting Likert survey results is by assigning a value to each option and adding those values together. This gives each customer a score. KyLeads surveys breaks down these percentages for you.
It’s a simple but an effective way to understand how respondents feel about each question. You’ll quickly determine which areas need improvement and the places you’re already doing well in.
Many organizations think they’re doing well in most areas. When they start using Likert scales, they realize there’s a lot of variability in the responses. This can be a reason to dig deeper and figure out why there’s inconsistent service delivery.
Above all, it’s important to focus on getting clean data. If your data is skewed in one direction or another, it’ll be difficult to take the right actions.
Common causes of distortion
There are limitations to the Likert scale’s ability to measure sentiment. Not because of the questionnaire methodology but due to the individuals responding to it. Humans have biases.
Central tendency bias
Central tendency bias is when a survey respondent chooses options closer to the center of the rating scale and avoids options at either extreme. For example, on a 10-point rating scale, a customer may rate almost everything in the 4-7 range. Only one or two questions get an 8-10 or 1-3 response.
One possible reason is that survey respondent gets caught up in the semantics of what “extreme” means. They don’t have a clear grasp of it for the particular question asked.
For example, you may have delivered an excellent product for them and they’re pleased with it. When you ask “how would you rate the quality of the product?” (with extremely good to extremely poor as options) they may be impressed with the product quality but aren’t sure it’s the best they’ve ever had or will have. They hesitate to call it extreme and choose an answer closer to the center of the scale.
Another reason is because in order for them to give more than one “extreme” answer, the level of satisfaction or quality must be consistent. If they give you an “extreme” for customer service, your product must also be on the same level to warrant an “extreme” answer.
Avoid central tendency bias by defining what certain terms mean within the survey’s context. For example, you can give context around the meaning of “extremely” so a customer won’t get caught up in the semantics. You can also provide space for them to expand on their answer and give reasons why they feel that way.
Extreme response bias
Central tendency bias see respondents stick to the milder answers while extreme response bias has respondents which only answer at the extremes.
There are a number of reasons for this such as:
- The way a question is worded
- Cultural factors
- Intelligence and education levels
- The effort put in when answering the questions
Most of the factors that cause the extreme response bias are out of your control. You have power over the way the question is worded so make sure you don’t ask leading questions. They predispose a respondent to answer a certain way and skew your data.
For example, “the service you received from our organization was great, wouldn’t you agree?” is a leading question.
Another thing you can do is carefully choose the demographic groups represented in your survey. Studies have found that individuals from Latin America and The Middle East are more likely to be affected by this bias. Those from Western Europe and East Asia are less likely to be affected.
Demographic and cultural markers aren’t 100% accurate because individuals are unique. The only way to be sure is to ask respondents why they answered the way they did.
Gauge the effort put in by looking at how long it took a customer to complete a survey (This is done automatically in KyLeads). If it took them a minute to complete a 20 question Likert survey, it may be a sign that they didn’t put in much effort.
Acquiescence bias
The Acquiescence bias occurs when respondents of a rating scale survey agree with all statements. In essence, they don’t want get on your bad side. Or they want to follow what appear to be social norms.
A common example is when a customer needs help and someone from your business tries to steer them in the right direction but falls short. Maybe they wanted to use the product in a certain way or integrate with other tools but couldn’t figure out how to do it. When they contact support, the rep tries to help but they still can’t figure it out.
When the customer is sent a survey, they’re appreciative of the effort the rep put in even though they couldn’t solve the problem. Instead of choosing an answer that’s in line with how they truly feel, they choose a more positive answer.
Another situation where this may happen is when there are socially acceptable responses. For example, “do you agree that it’s better to give than to receive?” In a social context, the answer is yes.
Avoid this bias by asking clear questions that address specific situations. For example, instead of asking about customer service in general, ask about how knowledgeable reps were, whether the customer issue was resolved, the willingness of the rep to help, etc.
Also make it clear what the purpose of the questionnaire is. If you want to improve service or a product then let your customers know that honest answers are the most helpful to you and them.
Likert scale questions & examples
Any time you want to get a better understanding of customer behavior or sentiment, a Likert scale can be used. With that being said, there are common types which are used more often.
I’ll illustrate with examples.
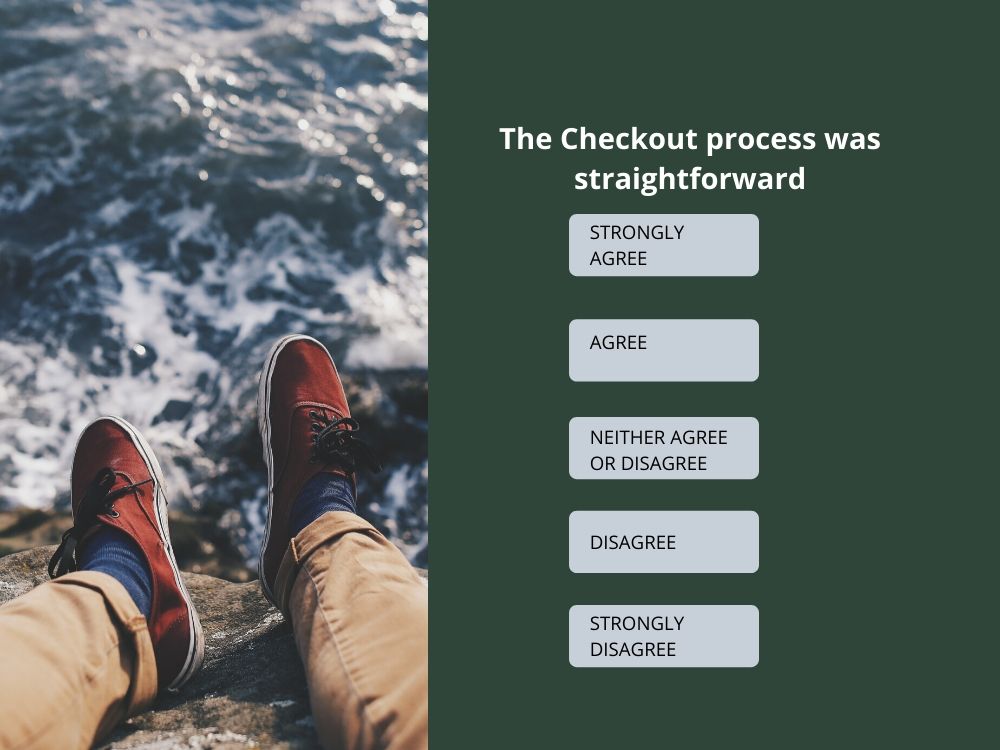
Agreement Likert scale questions
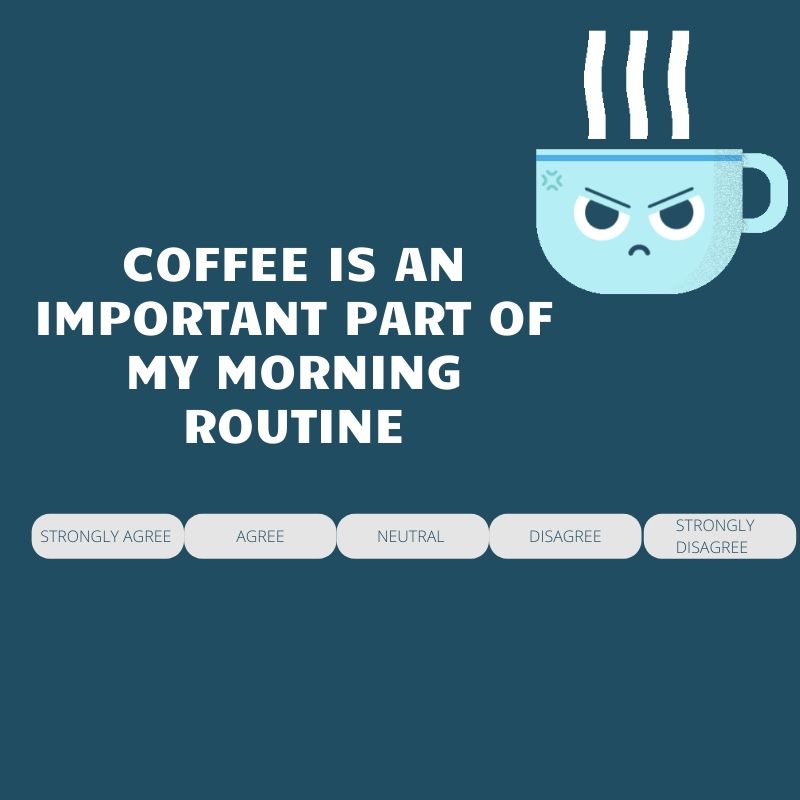
This is the most common type of Likert scale question and the easiest for your customer to answer. Respondents are provided with questions and they indicate the degree of agreement (or disagreement) they have with it.
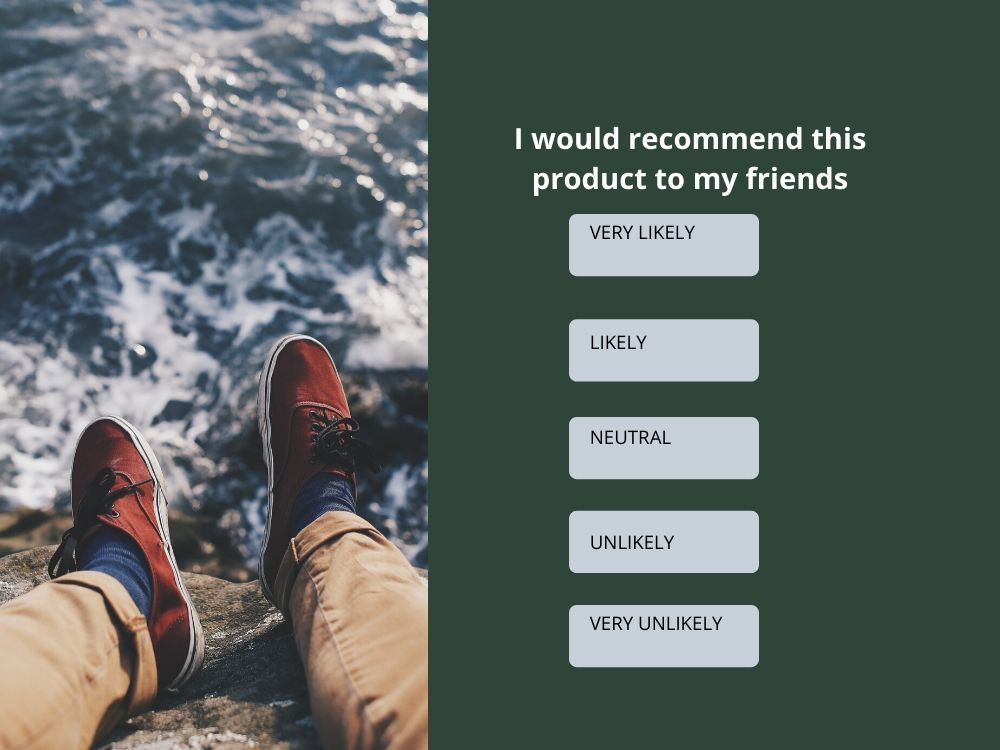
Likelihood Likert scale questions
The likelihood version seeks to understand the chances that someone will perform a specific action or adopt a behavior. It can be used to gauge whether or not someone will recommend or use a product.
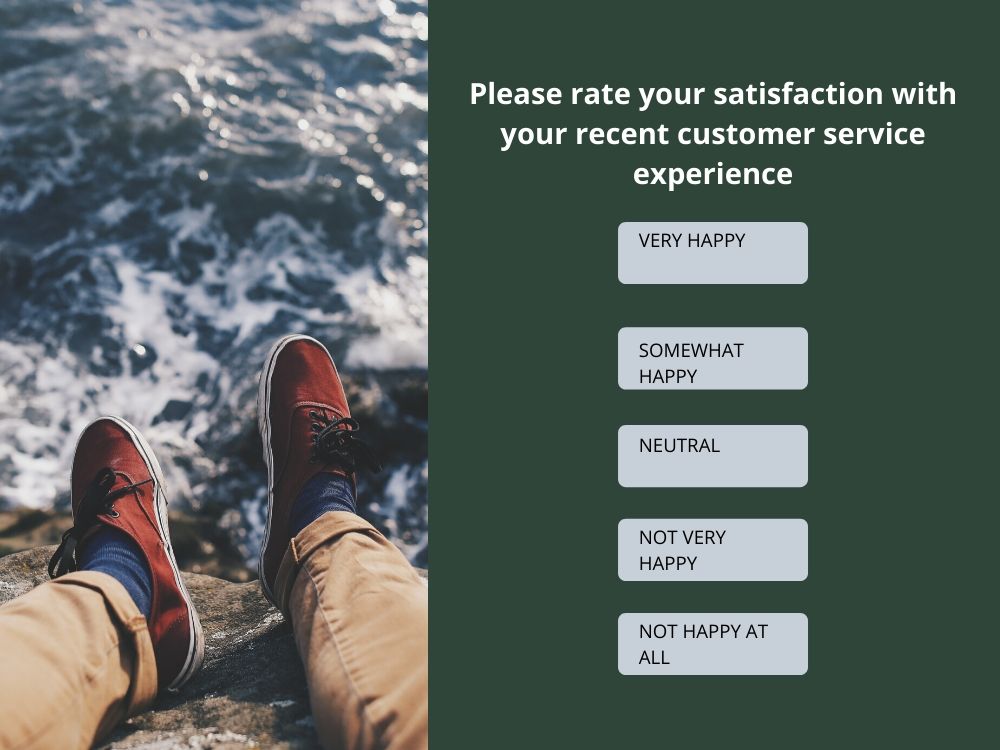
Satisfaction Likert scale questions
As the name implies, this form of the scale can help you understand satisfaction as relates to almost anything. It’s commonly used to understand how customers feel about specific products, services, and customer support interactions. It can also extend to usability, features, and even events.
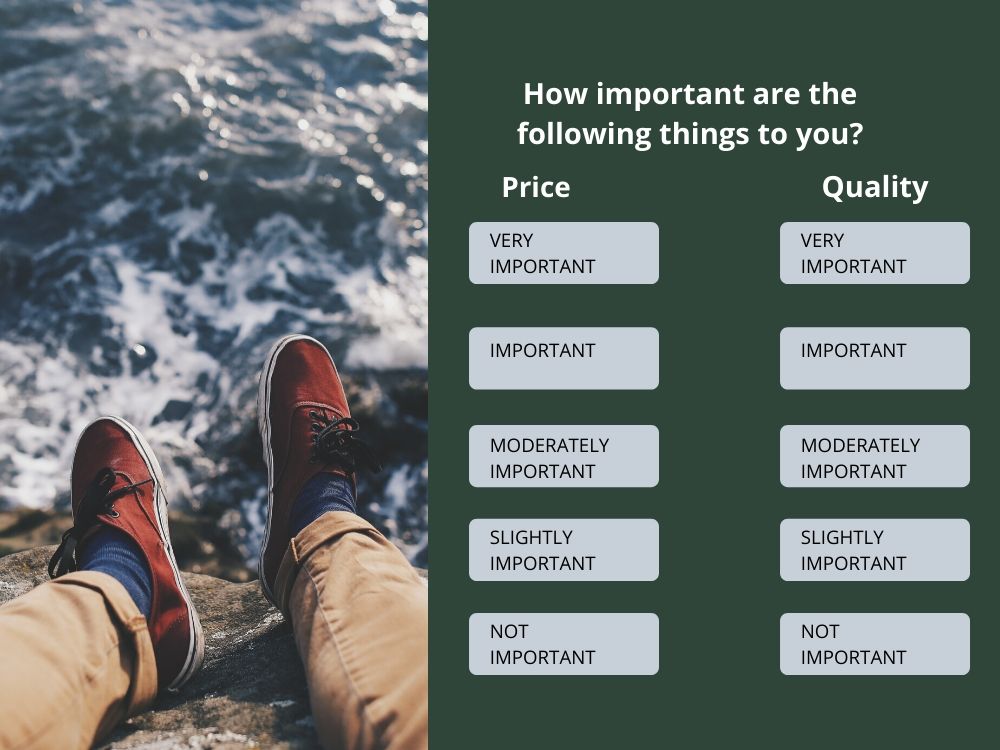
Importance Likert scale questions
This type of Likert scale focuses on how important something is to someone. Use it to unearth information about the reasons behind general opinions or stances on topics. It can also give you insights into how strongly each reason affects the overall perspective.
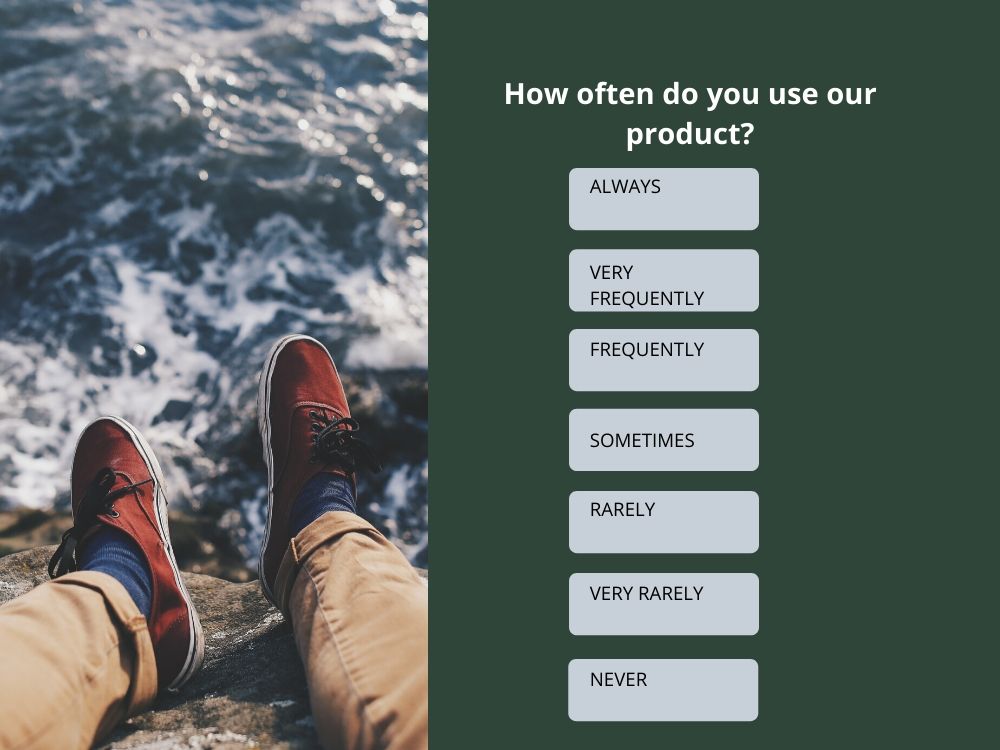
Frequency Likert scale questions
This scale determines how often an action is performed or how often something is considered. It gives you insights into how important something is in the customer’s routine or workflow. Always, very frequently, frequently, sometimes, rarely, very rarely, never.
Quality Likert scale questions
This gives you an idea of the perception of your product or service in the eyes of the customer. These work best when you break the questions out into specific aspects of a product or service instead of an overall assessment because even if it’s good overall, it may have specific areas that are lacking. General questions won’t uncover that. “extremely poor, below average, average, above average, excellent.”
Conclusion
Likert scale surveys are a powerful way to understand your customer’s experience and satisfaction with your products, services, and business as a whole. It’ll make it possible to spot areas where you’re doing well and those where you need the most improvement.