Let’s face it—lead generation can feel like a guessing game if you don’t know which numbers actually matter. With so many metrics to track, it’s easy to get overwhelmed and lose sight of what really drives results for your business.
So, how do you figure out which KPIs and metrics deserve your attention?
Whether you’re a marketer fine-tuning campaigns, a sales manager focused on closing deals, or a business owner trying to optimize resources, understanding the right metrics is the key to better decisions and stronger outcomes.
That’s why we’ve put together this list of the 7 most important lead generation KPIs and metrics you need to assess, improve, and master your strategies. Let’s dive in!
Why Tracking Lead Generation KPIs is Crucial for Business Growth?
Lead generation is the biggest challenge for 61% of marketers.
Can you guess why?
Because generating new leads isn’t just about filling up a pipeline—it’s the first and most important step toward gaining new customers, increasing revenue, and driving business growth.
Think about it: No business can thrive, let alone grow, with a stagnant customer base. A lack of new leads means no room for innovation, no way to expand into new markets, and no chance to stay competitive.
But here’s the thing—just generating leads isn’t enough. You also need to track the right KPIs to ensure your efforts are paying off. Why?
- To measure how well your lead generation strategies are performing;
- To identify what’s working and what’s not, so you can double down on your strengths;
- To make smarter, data-driven decisions and optimize your resources for better results;
- To focus on high-value leads that truly matter for your business;
- And most importantly, to align your marketing and sales teams so they’re working together seamlessly.
Remember, you’re not the only one vying for the same leads. By keeping a close eye on your lead generation KPIs, you’ll be a step ahead of the competition, turning insights into actions that fuel real growth.
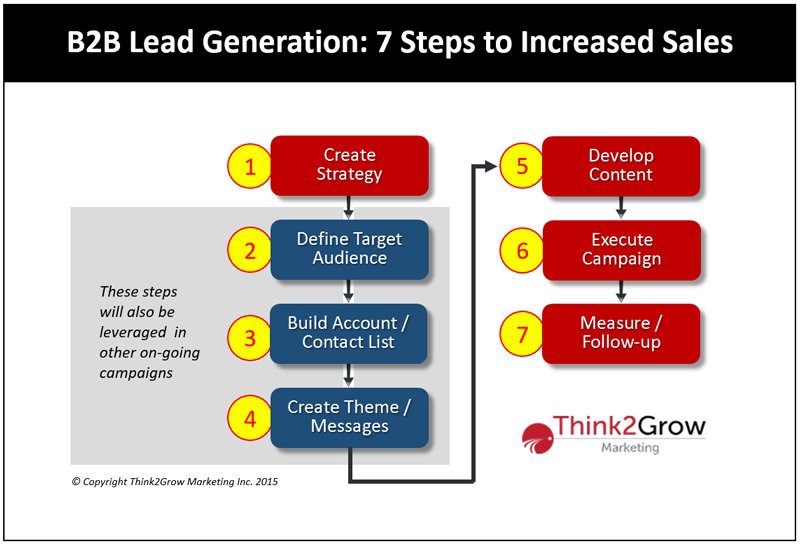
Top 7 Lead Generation KPIs and Metrics to Measure
When you think about the journey from lead to customer, not every touchpoint plays an equal role. Some are game-changers, while others provide subtle nudges.
But here’s the real question: Which touchpoint was pivotal in bringing that customer your way?
Tracking key performance indicators (KPIs) and metrics not only answers that question but also reveals deeper insights into your customers—their preferences, motivations, and behaviors. And when you know why your leads are converting, you can create smarter strategies that drive even better results. To amplify these strategies, consider leveraging the expertise of a full-stack digital marketer to optimize your marketing efforts.
Let’s break down the top 7 KPIs and metrics you need to focus on:
| Metric | Definition | Purpose | How to Measure? |
| Cost per Lead (CPL) | The total cost spent on acquiring one lead. | Helps assess the spending on lead generation. | Divide your total marketing spend by the total number of leads. |
| Lead Conversion Rate | Number of leads taking the desired action. | Evaluate how effectively your marketing funnel turns leads into customers. | If 10 out of 100 leads convert, your conversion rate is 10%. |
| Customer Acquisition Cost (CAC) | Total cost of acquiring new customers. | Measure the cost-efficiency of converting leads into paying customers. | Divide total expenses (e.g., $10,000) by the number of customers acquired (e.g., 100 = $100 CAC). |
| Engagement | Tracks audience interaction with content (social media, website, etc.). | Identify high-impact channels and the type of content that resonates with your audience. | Measure social media interactions and website metrics like bounce rate for new and recurring visitors. |
| Attribution | Tracks which channels or touchpoints drive leads and conversions. | Optimize resource allocation by focusing on high-performing channels. | Use models like single-touch, last-touch, or multi-touch attribution to track effectiveness. |
| Monthly Recurring Revenue (MRR) | The consistent monthly income from subscriptions or recurring customers. | Assess your business’s growth and financial stability. | Multiply the number of paying customers by the recurring monthly subscription amount. |
| Return on Ad Spend (ROAS) | Revenue generated for every dollar spent on advertising. | Evaluate the profitability and effectiveness of ad campaigns. | Divide total revenue generated by total ad spend over a specific period. |
Cost per Lead (CPL)
CPL is the total cost a business spends to acquire a single lead. Think of it as the amount you invest to guide a potential customer through every stage of their journey—right from discovering your brand to showing interest in your products or services.
Measuring CPL helps you figure out how efficient your marketing campaigns are. It shows whether you’re spending wisely to attract potential customers or if there’s room for optimization.
A lower CPL means you’re doing a great job at running cost-effective campaigns. It’s a sign that your strategies are working, and you can keep scaling them to bring in more leads. On the other hand, a high CPL signals inefficiency. It could mean that your ads, targeting, or overall strategy need tweaking to improve performance.
How to measure?
CPL = Total Marketing Spend / Total Number of Leads
For example, let’s say you spend $1,000 on a marketing campaign, and by the end of it, you generate 100 new leads. Using the formula:
CPL = $1,000 ÷ 100 = $10
This means you’re spending $10 to acquire each lead.
Lead Conversion Rate
Lead Conversion Rate is all about the percentage of leads that take a specific, desired action. This action could be anything—signing up for a newsletter, requesting a demo, or completing a purchase. Essentially, it measures how effectively your marketing funnel is turning leads into customers.
This metric acts as a reality check for your marketing and sales efforts:
- A higher conversion rate means your strategies are working well, and your funnel efficiently guides leads toward action;
- A lower conversion rate might indicate bottlenecks, such as weak messaging, poor lead targeting, or inefficiencies in your follow-up process.
How to measure?
Lead Conversion Rate = (Converted Leads / Total Leads) * 100
Let’s say you generated 100 leads in a month, and 10 of them converted into paying customers.
Lead Conversion Rate = (10 ÷ 100) × 100 = 10%
This means your funnel converts 10% of your leads into customers.
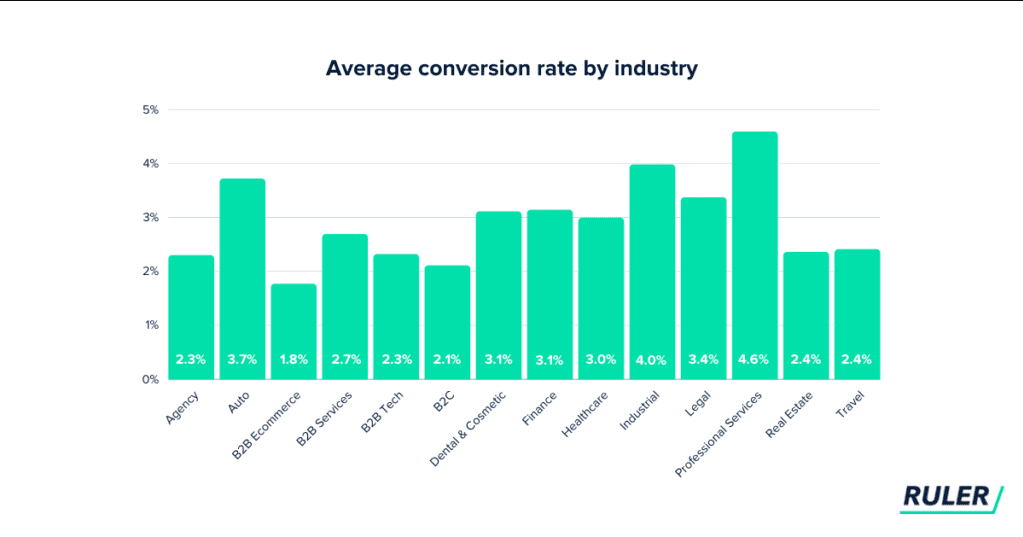
The ideal lead conversion rate is different for different industries, so be sure to check your industry’s conversion rate and build strategies accordingly.
Customer Acquisition Cost (CAC)
Customer Acquisition Cost (CAC) tells you how much money you’re spending to acquire a single customer. This includes all expenses—marketing campaigns, sales efforts, tools, and even personnel costs. Essentially, it’s the price tag for turning a lead into a paying customer.
Remember that it’s about “cost-efficiency.” So, the key element of this metric is to bring down the CAC as much as you can by implementing different marketing and sales strategies. This not only helps optimize your budget but also reduces technical debt by streamlining processes and eliminating inefficiencies in your marketing and sales operations. Additionally, when considering the app development cost, it’s crucial to factor in how these strategies can help lower your overall CAC by effectively targeting potential customers.
How to measure?
CAC = [Total Marketing + Total Sales Costs] / Total New Customers
For example, if you spend $10,000 on marketing and sales in a month and acquire 100 new customers, your CAC would be:
CAC = $10,000 ÷ 100 = $100
This means you’re spending $100 to acquire each customer.
Lowering your CAC is all about improving cost-efficiency without compromising quality.
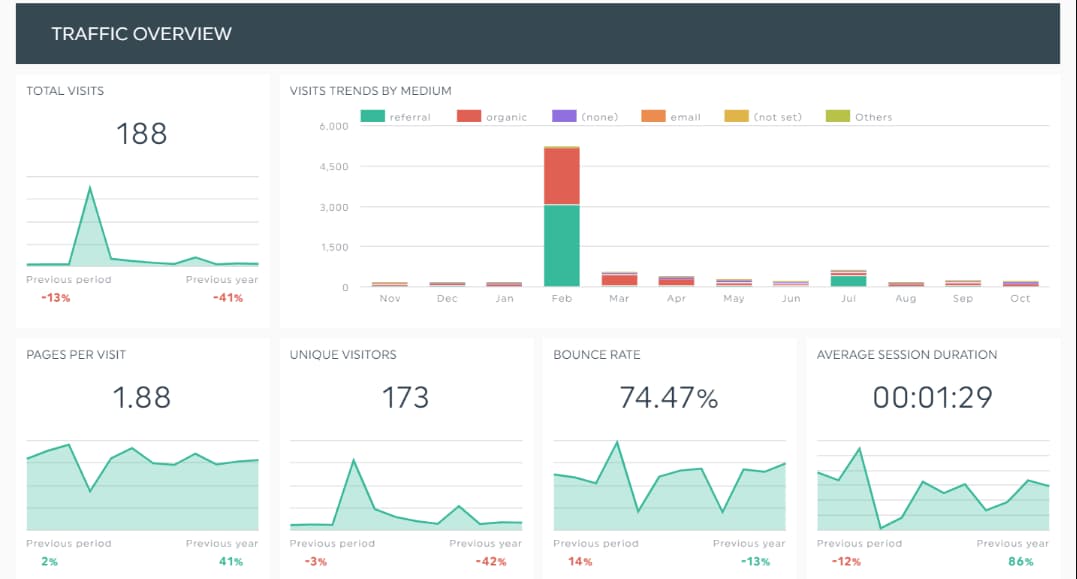
Engagement
Engagement is all about how your audience interacts with your content—be it social media posts, ads, emails, website widgets such as Facebook website widgets, video ads, or your website. It’s the level of activity, interest, and interaction your content sparks in your target audience.
The more your audience interacts with your content, the more likely they are to connect with your brand and, eventually, convert into loyal customers.
“With TikTok alone, the potential revenue generation is $1.09 billion.”
Now imagine the impact of choosing the right channels for your business—especially when you know how to track the performance of each and identify the key KPIs that matter.
[Vineet Gupta, Founder of 2XSAS]
How to measure?
Measuring engagement is also about evaluating the effectiveness of your content. Social media analytics tools can help by providing insights into what resonates with your audience, which posts drive the most interaction, and how to refine your strategy for better results. No social media page or email campaign becomes an instant success after the first interaction. Building meaningful engagement takes time, consistency, and valuable content.
When your posts, emails, or website provide genuine value, they naturally achieve higher engagement rates.
Engagement can be tracked through a variety of metrics depending on the channel:
- Emails: Click-through rates (CTR) and open rates;
- Websites: Metrics like time spent on the page and bounce rate;
- Social Media: Likes, comments, shares, saves, and follows.
Attribution
Attribution helps you pinpoint which marketing channels or touchpoints are delivering real results in generating and converting leads. By understanding attribution, you can effectively allocate resources to the most impactful channels and focus your efforts where they matter most.
Attribution isn’t just about tracking the final step before conversion—it’s about analyzing the entire customer journey. From the first interaction to the moment of purchase, every touchpoint plays a role in shaping your lead’s decision-making process. Leveraging omnichannel feedback helps you understand how each interaction influences your customer’s decisions, providing a holistic view of their journey.
How to measure?
You can measure attribution using several models, each offering unique insights into your lead generation strategy:
- First-Touch Model: Attributes credit to the first channel that introduced your lead to your brand;
- Last-Touch Model: Focuses on the final channel or interaction that led to the conversion;
- Multi-Touch Model: Distributes credit across all touchpoints, providing a more holistic view of the customer journey.
Monthly Recurring Revenue (MRR)
MRR is a key metric for subscription-based businesses or those relying on recurring billing. It serves as a reliable indicator of business growth and financial stability.
Companies with a high MRR demonstrate consistent lead generation, strong conversion rates, and effective customer retention—driven by exceptional products or services.
How to measure?
MRR = ARPA * Number of Active Customers
Here, ARPA (Average Revenue Per Account) represents the average revenue generated from a single account within a specific period.
For example, if you have 50 active customers paying $100 per month, your MRR is calculated as:
MRR = 50 × $100 = $5,000
Return on Ad Spend (ROAS)
ROAS is a key metric that evaluates the revenue generated for every dollar spent on advertising. In simpler terms, it tells you how effectively your ads are driving results and whether they’re worth the investment.
Tracking ROAS not only helps you measure the profitability of your ad campaigns but also enables you to refine your advertising budgets and strategies. The goal is to maximize returns while keeping ad costs under control. A higher ROAS means your ads are performing well and delivering strong results.
How to measure?
ROAS = Revenue from Ads / Ad Spend
For instance, if you spend $1,000 on an ad campaign and it generates $5,000 in revenue, your ROAS would be:
ROAS = $5,000 ÷ $1,000 = 5
This means you earn $5 for every $1 spent on advertising—a solid return!
Make sure to check the average ROAS for your industry to ensure your efforts align with the industry’s and channel’s average.
How to Identify the Right Lead Generation Metrics and KPIs for Your Business
To identify the right lead generation metrics for your business, use the following factors;
- Define your business goals;
- Identify what you need to achieve through lead generation;
- Use your sales funnel stage to choose stage-wise metrics;
- Analyze your target audience’s behavior and preferences;
- Assess the ideal type of content that works best for your target audience;
- Collaborate with sales, marketing, and finance teams to select KPIs.
Your Lead Generation Blueprint Starts Here!
Mastering the right lead generation metrics and KPIs is essential for driving smarter marketing strategies and sustainable business growth. By focusing on the numbers that matter, you can optimize campaigns, allocate resources effectively, and boost conversions.
Ready to elevate your lead generation game? Visit Kyleads.com to explore tools and strategies that simplify lead tracking and supercharge your growth journey.
Natasha Merchant:
I specialize in content marketing & I have been doing it for more than 6 years. I love creating content marketing maps for businesses. I have written content for various publication websites.
At present, I am helping SaaS to improve online visibility with the help of SEO, Content Marketing & Link Building.
Email: [email protected]
LinkedIn: https://www.linkedin.com/in/natasha-merchant-844528250/